


Top 5 Most Expensive Houses in Johnson County, KS.
Have you ever wondered what the most exclusive homes in Johnson county are selling for?

This week we will be starring Johnson County but will certainly include other counties in the metro.
#5
This Hallbrook Farms estate is the meaning of elegance. ($4,500,000)
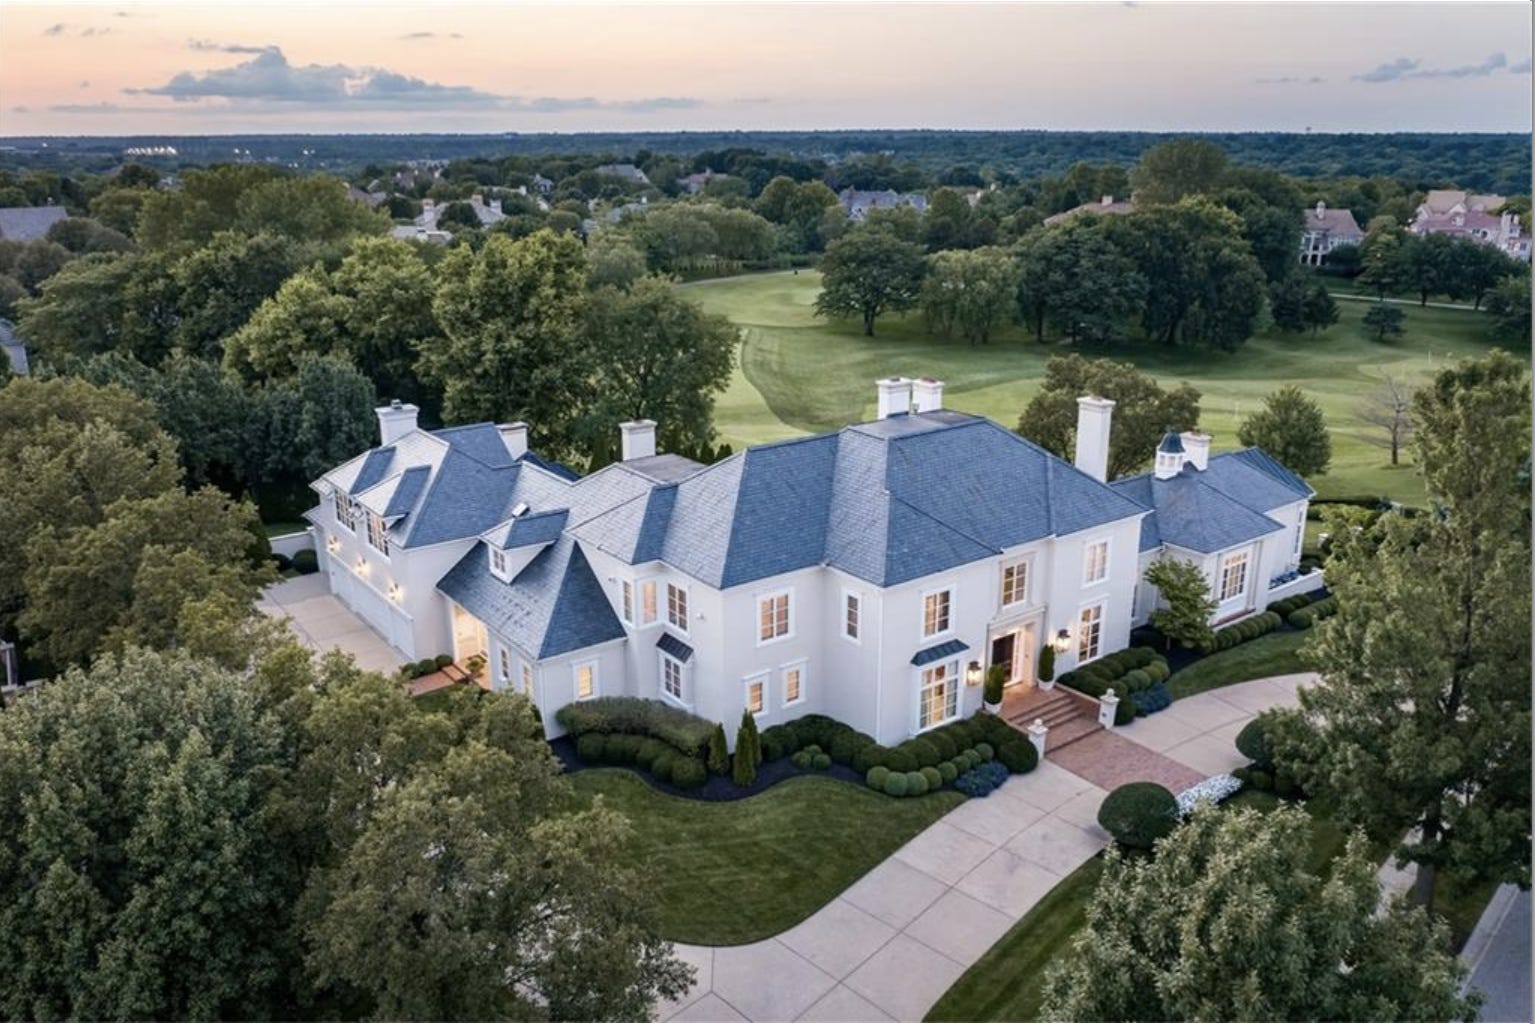
Click to view pictures- 2404 W 114th Street, Leawood, KS 66211
Listed by Kristen Malfer at Compass Realty Group
#4
5-million-dollar oasis on 6.3 acres. ($4,999,950)
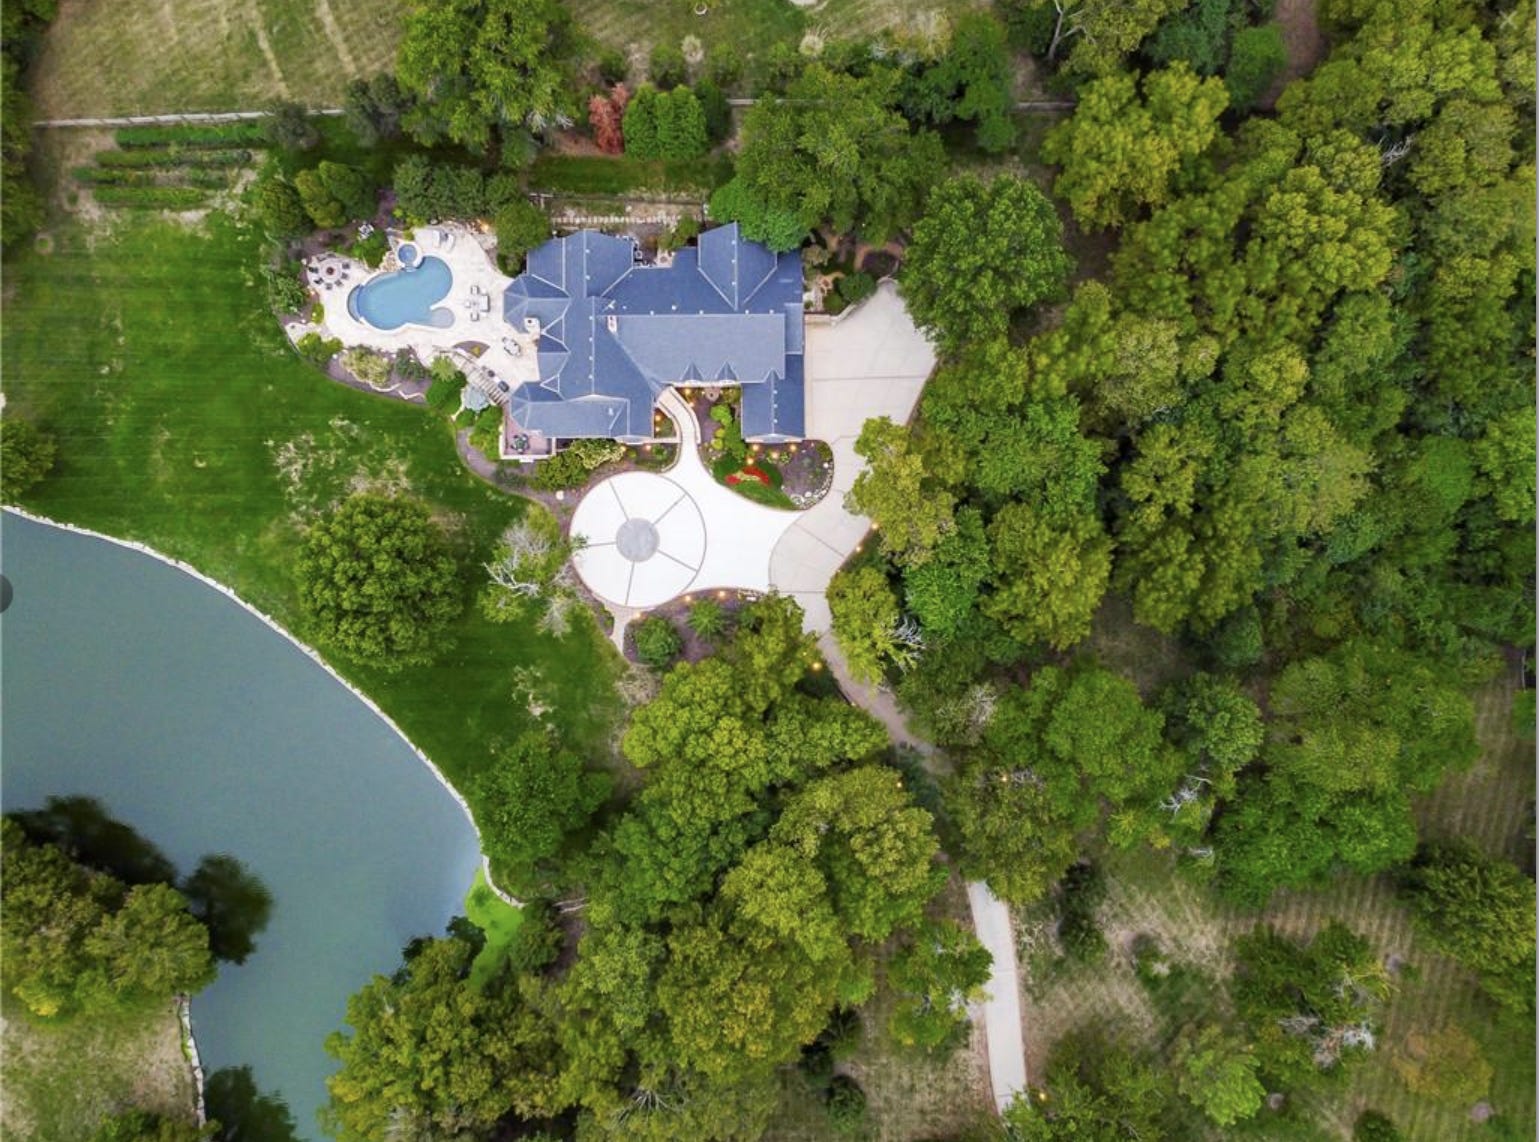
Click to view pictures- 3001 W 142nd Street, Leawood, KS 66224
Listed by Lindsay Shulze at Reece Nichols
#3
Mission Hills beauty with modern features. ($5,495,000)

Click to view pictures- 6140 High Drive, Mission Hills, KS 66208
Listed by Nancy Ward at Compass Realty
#2
Garnet hill custom-built masterpiece. ($5,950,000)

Click to view pictures- 10712 W 165th Street, Overland Park, KS 66221
Listed by Cami Jones at Reece Nichols
#1
The pinnacle of craftsmanship. ($7,500,000)

Click to view pictures- 5930 Oakwood Road, Mission Hills, KS 66208
Listed by Scott Strevell at Keller Williams Realty Partner


Closed Sales: - 0.4% We’ve had less closings by a small margin from March 2023. This isn’t surprising as we’ve had historically low number of sales from previous years.
Average Sales Price: As many think the average price is lower than last year. The numbers don’t lie. We have 5.0% increase from March 2023.
Median Sales Price: This number confirms the figure above with 6.3% increase from last year.
Days on Market: DOM is the number of days it takes for a property to sell. Have you noticed homes are taking longer to sale? Especially the ones priced in the higher price range above $450,000. We’re at 35 days up from 33 days last year.
% of Original Price Received: Fairly similar to last year, this is the figure that states what percentage of the original list price did the sellers receive.
Pending Sales: Up from last year by 7.6% which makes sense. This number is going to increase due to us coming out of a historic low number of pending sales for the last year.
Inventory: Inventory is up from last year at 6.4%. We do want this number to rise in order to create more inventory for buyers and there for a more normal market.
Supply: This has also increased by 16.7% which is the largest gain. 1.4 months is still relatively low compared to what we should have. A normal market for example should have 2-3 months of supply. A seller’s market usually has 4-6 months or more of supply. We’re still within a seller’s market at the moment but slowly moving into a normal market.
Conclusion: I think the prices are still remaining higher from last year due to the low inventory and supply. There’re some states in the country that are seeing lower prices right now due to them having a ton of inventory at the moment. That’s not the case in Kansas City yet. We’re still seeing very low inventory in the metro causing prices to stay higher. If we do see supply start to creep up, then we might start to see a dip in prices. The higher DOM is correlated to the higher interest rates. If rates come down this should help days on market come down and pending sales go up. The important thing to realize is there will be more pending sales, since we made a bottom in the number of sales we had in November 2022 when rates were getting hiked. We actually saw numbers come down as low as the pandemic low of April 2020, 2010 & 2007 all bottoms in the number of pending sales, which usually are made during the start of winter when sales come down. Ill add a chart below

If you’ve thought about buying or selling a home this year, I’d love to sit down & chat about it. Let me know what I can do to help.
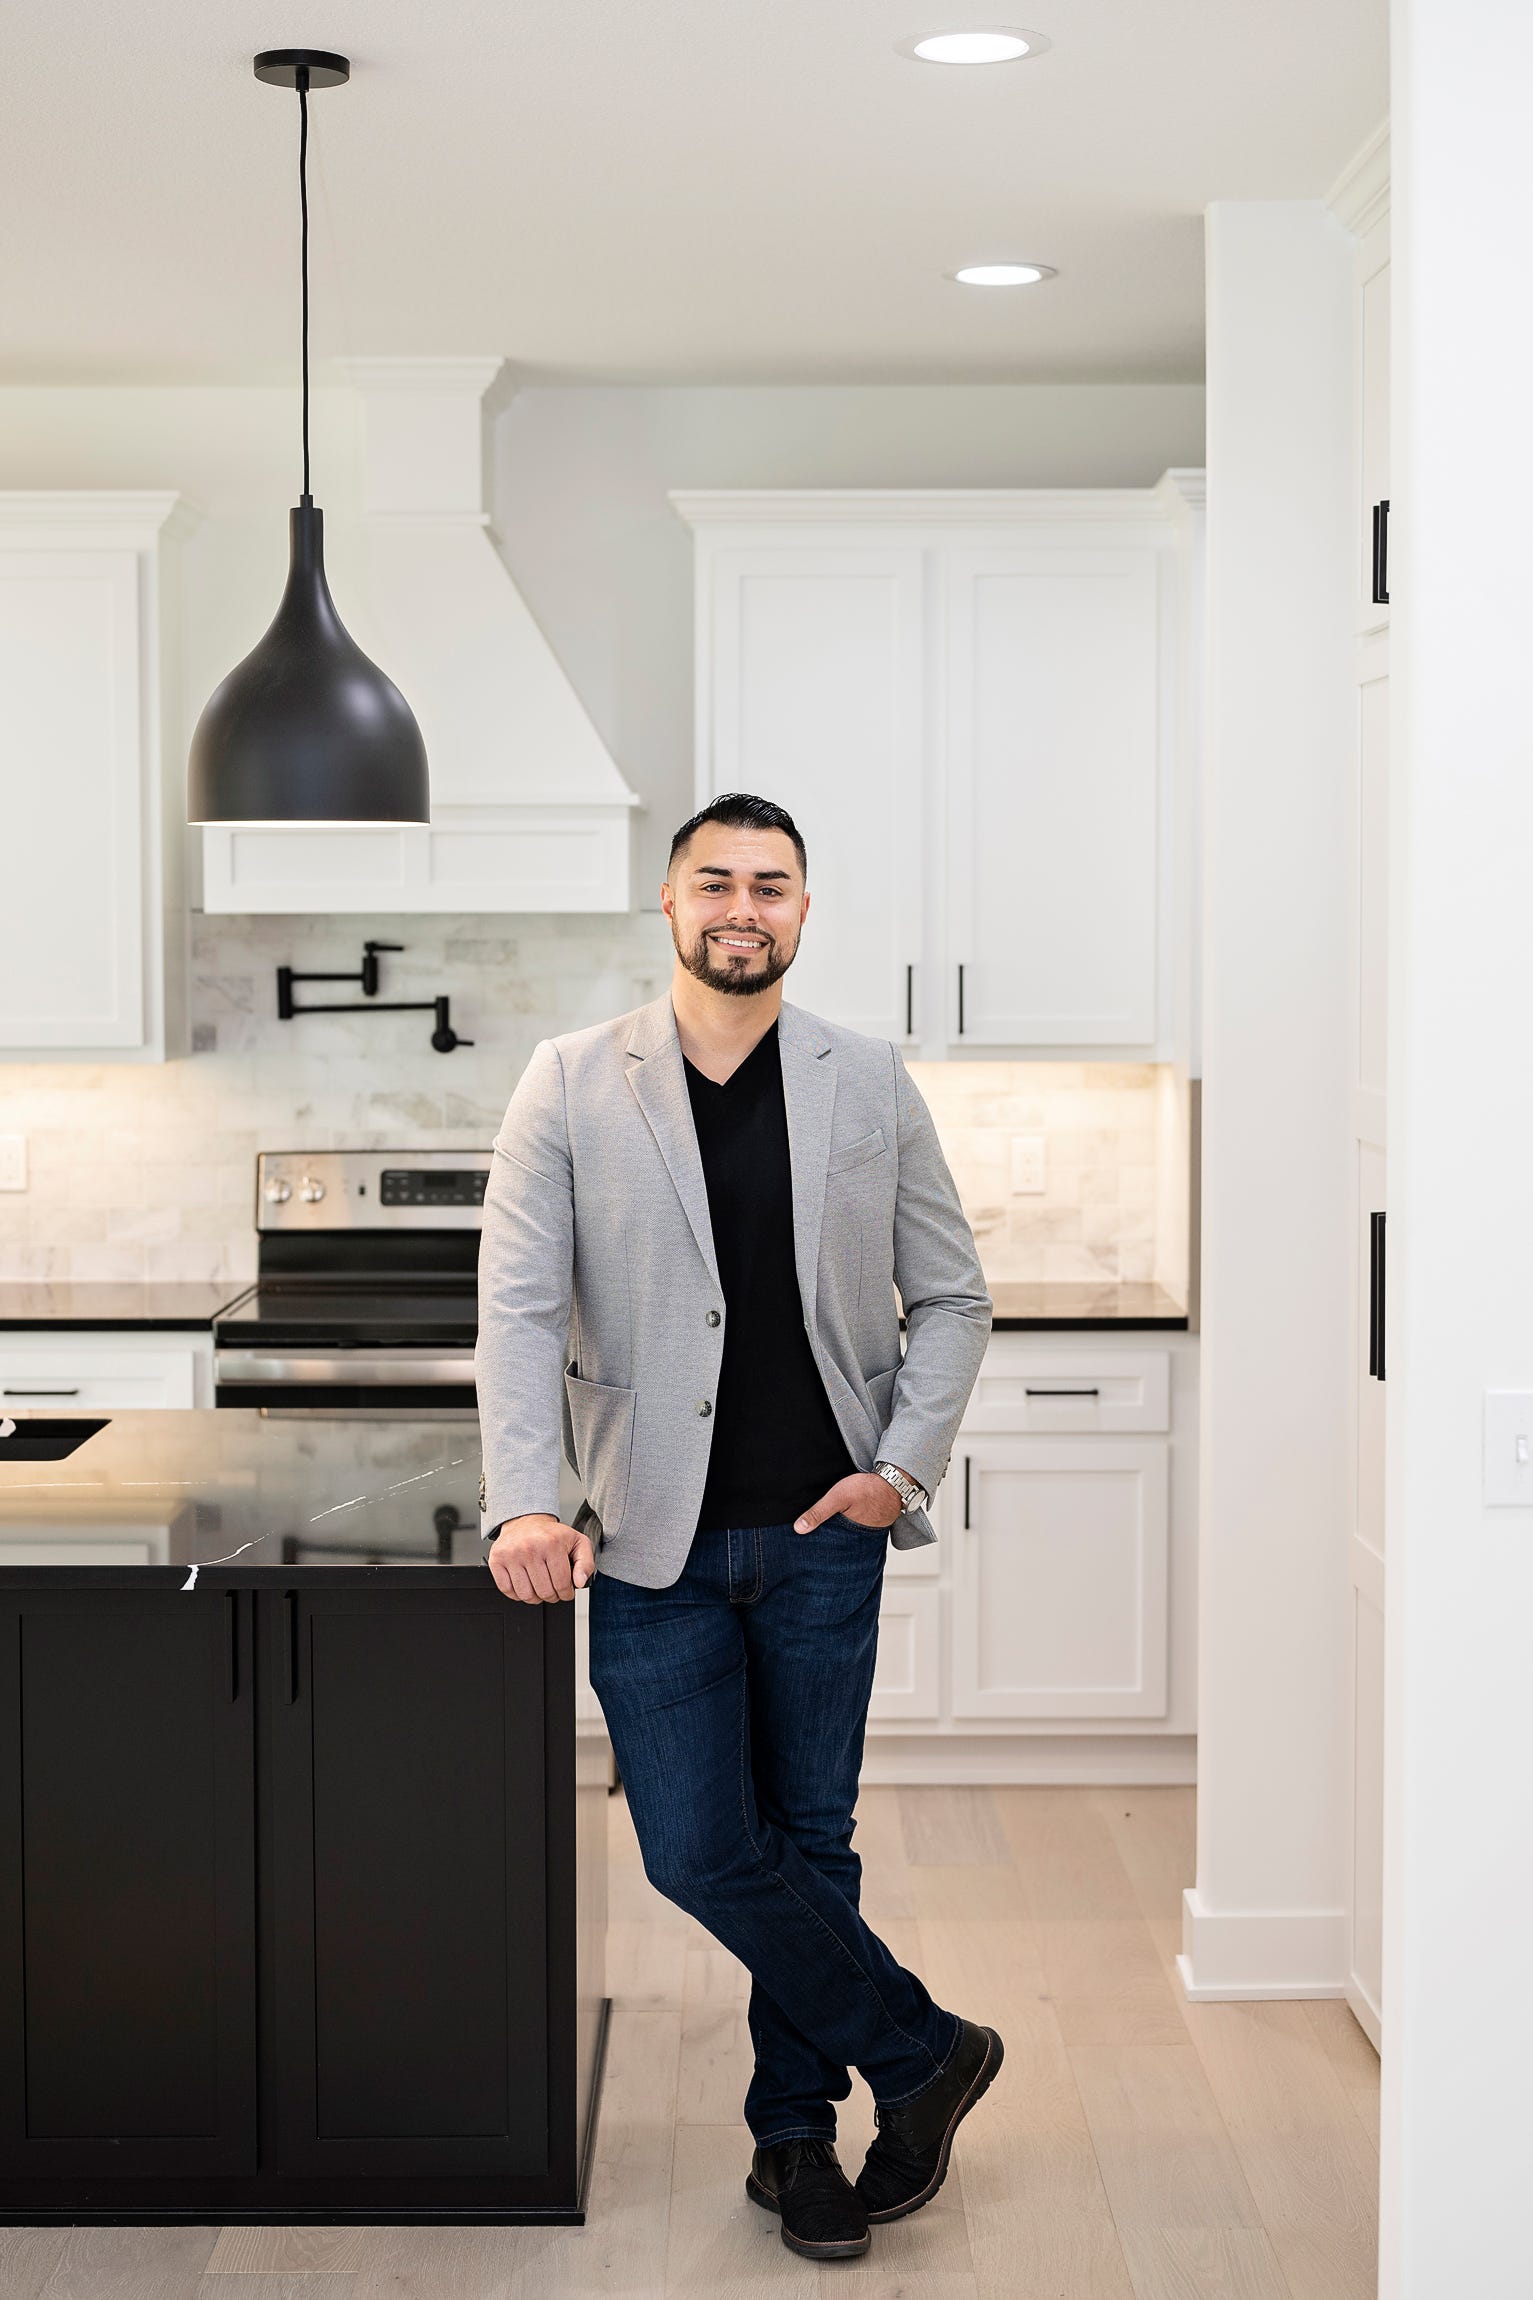
Marcos Chavez
Kansas City Realtor
Phone: 913-433-6115
Email: Mchavez@kw.com
